My Proxmox Server 2021
I planned to build a new Proxmox server for a while with much more memory and CPU power. So I choosed to build a new server on AM4 platform with Ryzen 7 5750GE CPU and 128GB of ECC RAM (Unbuferred).
I choosed 5750GE because it is advertised as a 35W TDP, it is a 8 core CPU with 16 threads and has great performance. This was the hardest part to get as it was out of stock everywhere and mostly available for OEMs and system bulders.
The AMD Ryzen 7 5750GE Pro can be a great choice for a home server for several reasons:
Energy efficiency: With a 35W TDP (Thermal Design Power), the Ryzen 7 5750GE is designed to consume less power compared to processors with higher TDPs. This can lead to lower energy bills and reduced heat generation, which is particularly important in a home server environment where power consumption and heat management are crucial.
Performance: The Ryzen 7 5750GE is based on AMD’s Zen 3 architecture, which offers improved performance per watt compared to previous generations. This processor features 8 cores and 16 threads, providing ample processing power for various server tasks, such as file sharing, media streaming, virtual machines, and more.
Integrated GPU: The Ryzen 7 5750GE is an APU (Accelerated Processing Unit), which means it has an integrated GPU (Graphics Processing Unit). This can be advantageous in a home server setup, as it eliminates the need for a dedicated graphics card, reducing power consumption, cost, and space requirements.
Low noise: Due to its lower TDP, the Ryzen 7 5750GE typically generates less heat, which means it can be cooled more easily and quietly. This can be an important factor for a home server, as a quieter system is more pleasant to have running 24/7 in a residential environment.
Cost-effectiveness: The Ryzen 7 5750GE offers a good balance of performance and cost, making it an attractive option for those looking to build a home server without breaking the bank.
In summary, the AMD Ryzen 7 5750GE with a 35W TDP is a great choice for a home server due to its energy efficiency, performance, integrated GPU, low noise generation, and cost-effectiveness. These factors make it a suitable option for various server tasks while maintaining a low-power and quiet profile, which is essential in a home setting.
While 2015 AMD AM1 5350 with 16GB RAM setup was quite ok for a dozen of VMs I was running out of RAM. A 2020 laptop with AMD Ryzen 7 4800H and 64GB of RAM was not practical for VM and work computer as it was getting hot when max it with a bunch of running VMs I decided to upgrade to a more powerful setup because
Part list
| Mainboard | Asrock b550m steel legend | €135.51 |
| CPU | AMD Ryzen 7 PRO 5750GE | €467.69 |
| Memory | 4 x Kingston KSM32ED8/32ME, 32GB, DDR4-3200MHZ, CL22 | €721.37 |
| Case | Deepcool Matrexx 30, Mini Tower, Tempered Glass (Black) | €31.42 |
| Source | Seasonic Focus GX-550, 550W, Gold, Full Modular | €59.85 |
| Cooler CPU | Noctua NH-U12S SE-AM4, 120mm | €56.42 |
| SSD | Kingston A400 480GB SATA 2.5inch - SA400S37/480G | €49.79 |
Update 2022-04-29: I soon realized that SSD wareout was too fast for my needs. So I added two new 4TB HDD and created a mirrored zfs storage pool.
| HDD Server | 1 x Western Digital Ultrastar DC HC310, 4TB, 7200RPM 3.5" SATA III - HUS726T4TALA6L4 | €142.65 |
| HDD Server | 1 x Western Digital Ultrastar DC HC310, 4TB, 7200RPM 3.5" SATA III - HUS726T4TALE6L4 | €170.90 |
In order to speed up the pool I added an old 128 GB SSD (Plextor PX-G128M6eA) for the cache (L2ARC) and for the log writes (ZIL / SLOG) by creating partitions for each purpose. This was not mirrored because I didn’t had another spare disk at the moment.
$ zpool iostat -vly 10 1
                                         capacity     operations     bandwidth    total_wait     disk_wait    syncq_wait    asyncq_wait  scrub   trim
pool                                   alloc   free   read  write   read  write   read  write   read  write   read  write   read  write   wait   wait
-------------------------------------  -----  -----  -----  -----  -----  -----  -----  -----  -----  -----  -----  -----  -----  -----  -----  -----
local-zfs1                              384G  3.25T     73    687   424K   109M   51ms   21ms   51ms    3ms  121us  983ns  835ns   21ms      -      -
  mirror-0                              384G  3.25T     73    595   424K   107M   51ms   24ms   51ms    3ms  121us  711ns  835ns   21ms      -      -
    ata-HGST_HUS726T4TALA6L4_YYYYYYYY      -      -     35    289   209K  53.5M   54ms   28ms   54ms    3ms   77us  912ns  768ns   24ms      -      -
    ata-HGST_HUS726T4TALE6L4_XXXXXXXX      -      -     37    305   215K  53.6M   49ms   21ms   49ms    3ms  162us  510ns  912ns   18ms      -      -
logs                                       -      -      -      -      -      -      -      -      -      -      -      -      -      -      -      -
  sdd2                                 15.7M  4.48G      0     92      0  1.73M      -  604us      -  600us      -    1us      -  688us      -      -
cache                                      -      -      -      -      -      -      -      -      -      -      -      -      -      -      -      -
  sdd1                                 19.1G  80.9G    127    344   522K  33.9M    1ms   23ms    1ms  771us    2us      -      -   22ms      -      -
-------------------------------------  -----  -----  -----  -----  -----  -----  -----  -----  -----  -----  -----  -----  -----  -----  -----  -----
Update 2023-04-29: My ZFS logs / cache SSD drive started to fail so I removed it but this increased the IO delay to more than 10%. This reconfirmed me once more that consummer SSD drives are not suitable for ZFS. Enterprise SSD have power loss protection which increase sustained 4k random writes IOPS. I tried to maximize the IOPS by using a U.2 SSD drive instead of SATA ones.
| SSD Server | SSD Server Kingston DC1500M, 960GB, PCIe NVMe Gen3 x4, 2.5inch - Cod produs: SEDC1500M/960G | €306.10 |
| PCIE U.2 Adapter | ICY BOX IB-PCI2017-U2 | €63.06 |
root@pve1:~# ip link show
2: enp7s0: <BROADCAST,MULTICAST,UP,LOWER_UP> mtu 1500 qdisc pfifo_fast master vmbr0 state UP mode DEFAULT group default qlen 1000
    link/ether 70:85:c2:96:3c:a4 brd ff:ff:ff:ff:ff:ff
When I checked the network interfaces configuration file /etc/network/interfaces I noticed that the network interface assigned to the bridge vmbr0 was wrong.
$ cat /etc/network/interfaces
auto lo
iface lo inet loopback

iface enp6s0 inet manual

auto vmbr0
iface vmbr0 inet static
        address 192.168.1.xx/24
        gateway 192.168.1.1
        bridge-ports enp6s0
        bridge-stp off
        bridge-fd 0
So I changed it to enp7s0 and rebooted the server.
$ nano /etc/network/interfaces
Check network interface after reboot
$ tcpdump --list-interfaces | grep enp
1.enp7s0 [Up, Running, Connected]
root@pve1:~# nvme list
Node             SN                   Model                                    Namespace Usage                      Format           FW Rev
---------------- -------------------- ---------------------------------------- --------- -------------------------- ---------------- --------
/dev/nvme0n1     500YYYYYYYYYYYYY     KINGSTON SEDC1500M960G                   1         960.20  GB / 960.20  GB    512   B +  0 B   S67F0103
/dev/nvme1n1     500XXXXXXXXXXXXX     KINGSTON SEDC1500M960G                   1         960.20  GB / 960.20  GB    512   B +  0 B   S67F0103
Find drive ids
$ ls -al /dev/disk/by-id/ | grep nvme-KING
lrwxrwxrwx 1 root root   13 Mar 12 18:58 nvme-KINGSTON_SEDC1500M960G_500YYYYYYYYYYYYY -> ../../nvme0n1
lrwxrwxrwx 1 root root   13 Mar 12 18:58 nvme-KINGSTON_SEDC1500M960G_500XXXXXXXXXXXXX-> ../../nvme1n1
Create ZFS pool
$ zpool create local-zfs mirror \
  /dev/disk/by-id/ nvme-KINGSTON_SEDC1500M960G_500YYYYYYYYYYYYY \
  /dev/disk/by-id/ nvme-KINGSTON_SEDC1500M960G_500XXXXXXXXXXXXX
Check ZFS pool
$ zpool status
  pool: local-zfs
 state: ONLINE
config:

        NAME                                              STATE     READ WRITE CKSUM
        local-zfs                                         ONLINE       0     0     0
          mirror-0                                        ONLINE       0     0     0
            nvme-KINGSTON_SEDC1500M960G_500YYYYYYYYYYYYY  ONLINE       0     0     0
            nvme-KINGSTON_SEDC1500M960G_500XXXXXXXXXXXXX  ONLINE       0     0     0

errors: No known data errors

  pool: local-zfs1
 state: ONLINE
  scan: scrub repaired 0B in 1 days 00:38:47 with 0 errors on Mon Mar 13 01:02:49 2023
config:

        NAME                                   STATE     READ WRITE CKSUM
        local-zfs1                             ONLINE       0     0     0
          mirror-0                             ONLINE       0     0     0
            ata-HGST_HUS726T4TALA6L4_YYYYYYYY  ONLINE       0     0     0
            ata-HGST_HUS726T4TALE6L4_XXXXXXXX  ONLINE       0     0     0

errors: No known data errors
Check ZFS pool performance
$ zpool iostat -vly 10 1
                                                    capacity     operations     bandwidth    total_wait     disk_wait    syncq_wait    asyncq_wait  scrub   trim
pool                                              alloc   free   read  write   read  write   read  write   read  write   read  write   read  write   wait   wait
------------------------------------------------  -----  -----  -----  -----  -----  -----  -----  -----  -----  -----  -----  -----  -----  -----  -----  -----
local-zfs                                          226G   662G      3    645  30.4K  11.8M  124us  285us  118us   42us    1us  474ns      -    1ms      -      -
  mirror-0                                         226G   662G      3    645  30.4K  11.8M  124us  285us  118us   42us    1us  474ns      -    1ms      -      -
    nvme-KINGSTON_SEDC1500M960G_500YYYYYYYYYYYYY      -      -      1    323  15.2K  5.91M  134us  223us  129us   39us    1us  603ns      -  990us      -      -
    nvme-KINGSTON_SEDC1500M960G_500XXXXXXXXXXXXX      -      -      1    322  15.2K  5.91M  113us  348us  108us   46us    1us  344ns      -    1ms      -      -
------------------------------------------------  -----  -----  -----  -----  -----  -----  -----  -----  -----  -----  -----  -----  -----  -----  -----  -----
local-zfs1                                         662G  2.98T      0     56  6.40K  1.12M  393us    2ms  393us  652us    1us  822ns      -    3ms      -      -
  mirror-0                                         662G  2.98T      0     56  6.40K  1.12M  393us    2ms  393us  652us    1us  822ns      -    3ms      -      -
    ata-HGST_HUS726T4TALA6L4_YYYYYYYY                 -      -      0     28      0   575K      -    3ms      -  787us      -    1us      -    4ms      -      -
    ata-HGST_HUS726T4TALE6L4_XXXXXXXX                 -      -      0     28  6.40K   575K  393us    1ms  393us  518us    1us  632ns      -    2ms      -      -
------------------------------------------------  -----  -----  -----  -----  -----  -----  -----  -----  -----  -----  -----  -----  -----  -----  -----  -----
Note: All zpool iostat commands were executed in parallel with few VM workloads on pool, so they are orientative.
Update 2023-03-21: Check wear level of SSDs
I have an ssd that writes 4.7 TB in 10 days. what was the average writing speed? To calculate the average writing speed, we need to divide the total amount of data written by the time taken to write it:
Average writing speed = Total amount of data written / Time taken
We are given that the SSD wrote 4.7 TB of data in 10 days, which is equivalent to 4700 GB in 10 days. To convert this to a speed in GB per day, we can divide by 10:
Average writing speed = 4700 GB / 10 days = 470 GB/day
Therefore, the average writing speed of the SSD is 470 GB/day.
To convert the average writing speed from GB/day to MB/s, we need to perform a few more calculations.
First, we need to convert GB to MB by multiplying by 1024:
470 GB/day x 1024 MB/GB = 481280 MB/day
Next, we need to convert days to seconds by multiplying by 86400 (the number of seconds in a day):
10 days x 86400 seconds/day = 864000 seconds
Finally, we can calculate the average writing speed in MB/s by dividing the total amount of data written (in MB) by the time taken (in seconds):
Average writing speed = 481280 MB / 864000 seconds = 0.556 MB/s
Therefore, the average writing speed of the SSD is approximately 0.556 MB/s.
Enable ZFS autotrim on pool with nvme SSDs
$ zpool get autotrim local-zfs
NAME       PROPERTY  VALUE     SOURCE
local-zfs  autotrim  off       default
$ zpool set autotrim=on local-zfs
$ zpool get autotrim local-zfs
NAME       PROPERTY  VALUE     SOURCE
local-zfs  autotrim  on        local
Enable ZFS periodic trim on pool with nvme SSDs
$ zfs set org.debian:periodic-trim=enable local-zfs
$ zfs get org.debian:periodic-trim local-zfs
NAME       PROPERTY                  VALUE                     SOURCE
local-zfs  org.debian:periodic-trim  enable                    local
Check SSDs SMART data
$ smartctl /dev/nvme0 -a | grep "Data Units Read:\|Data Units Written:\|Host Read Commands:\|Host Write Commands:\|Power On Hours:"
Data Units Read:                    185,599 [95.0 GB]
Data Units Written:                 10,013,869 [5.12 TB]
Host Read Commands:                 8,194,144
Host Write Commands:                343,660,301
Power On Hours:                     201
$ smartctl /dev/nvme1 -a | grep "Data Units Read:\|Data Units Written:\|Host Read Commands:\|Host Write Commands:\|Power On Hours:"
Data Units Read:                    178,547 [91.4 GB]
Data Units Written:                 10,013,978 [5.12 TB]
Host Read Commands:                 8,114,286
Host Write Commands:                343,339,912
Power On Hours:                     202
See: https://wiki.debian.org/ZFS#TRIM_support
Check SSDs TRIM status and TRIM SSDs
root@pve1:~# zpool status -t local-zfs
  pool: local-zfs
 state: ONLINE
config:

        NAME                                              STATE     READ WRITE CKSUM
        local-zfs                                         ONLINE       0     0     0
          mirror-0                                        ONLINE       0     0     0
            nvme-KINGSTON_SEDC1500M960G_50026B7282A4F49F  ONLINE       0     0     0  (untrimmed)
            nvme-KINGSTON_SEDC1500M960G_50026B7282A4F530  ONLINE       0     0     0  (untrimmed)

errors: No known data errors
root@pve1:~# zpool trim local-zfs
root@pve1:~# zpool status -t local-zfs
  pool: local-zfs
 state: ONLINE
config:

        NAME                                              STATE     READ WRITE CKSUM
        local-zfs                                         ONLINE       0     0     0
          mirror-0                                        ONLINE       0     0     0
            nvme-KINGSTON_SEDC1500M960G_50026B7282A4F49F  ONLINE       0     0     0  (7% trimmed, started at Tue 21 Mar 2023 04:59:56 AM EET)
            nvme-KINGSTON_SEDC1500M960G_50026B7282A4F530  ONLINE       0     0     0  (7% trimmed, started at Tue 21 Mar 2023 04:59:56 AM EET)
root@pve1:~# zpool status -t local-zfs
  pool: local-zfs
 state: ONLINE
config:

        NAME                                              STATE     READ WRITE CKSUM
        local-zfs                                         ONLINE       0     0     0
          mirror-0                                        ONLINE       0     0     0
            nvme-KINGSTON_SEDC1500M960G_50026B7282A4F49F  ONLINE       0     0     0  (100% trimmed, completed at Tue 21 Mar 2023 05:01:10 AM EET)
            nvme-KINGSTON_SEDC1500M960G_50026B7282A4F530  ONLINE       0     0     0  (100% trimmed, completed at Tue 21 Mar 2023 05:01:10 AM EET)
Current workload consist of:
- one lxd container which runs a docker
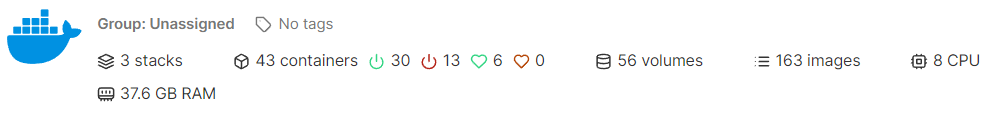
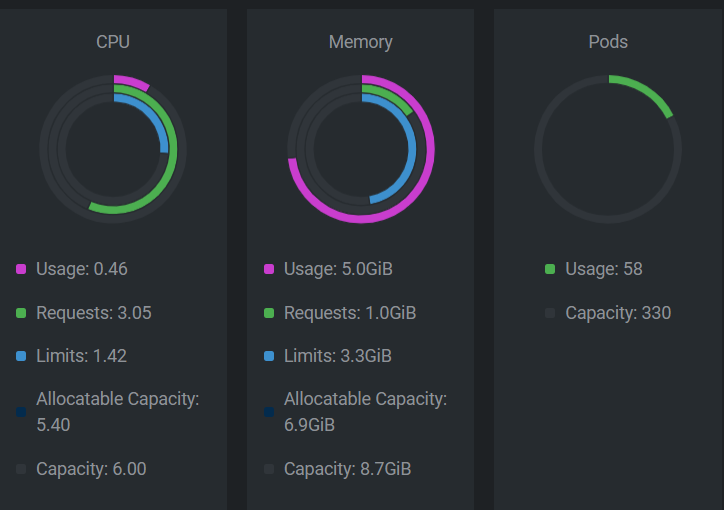
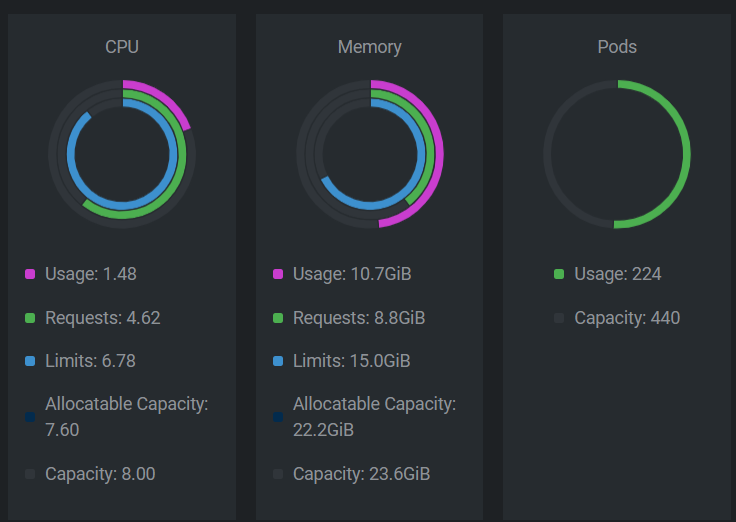
- only one currently powered k8s cluster (3 control planes, 4 workers)
According to https://etcd.io/docs/v3.5/op-guide/hardware/ etcd is requiring quite some IOPS.
DWPD = TBW * 1000 / (warrantied-days * capacity-in-GB) TBW = (DWPD * warrantied-days * capacity-in-GB) / 1000
Kingston DC1500M SSDs have a block size of 512 bytes per LBA, setting the ashift value to 9 is a good fit when creating a ZFS pool with these drives. This will ensure that ZFS is aligned with the native block size of the SSDs, optimizing performance and minimizing unnecessary wear.
$ nvme id-ns /dev/nvme0 --human-readable | grep "Data Size"
LBA Format  0 : Metadata Size: 0   bytes - Data Size: 512 bytes - Relative Performance: 0 Best (in use)

$ zpool set ashift=9 local-zfs
$ zpool get ashift local-zfs
NAME       PROPERTY  VALUE   SOURCE
local-zfs  ashift    9       local
By default, ZFS has atime enabled, which means that every time a file or directory is accessed, ZFS will update the access time metadata. However, this can lead to unnecessary writes and increased overhead, especially in situations where access time information is not critical, such as virtualization environments or large-scale storage systems.
By disabling atime updates will prevent ZFS from updating the access time metadata when files or directories are accessed, which can result in improved performance and reduced storage device wear.
root@pve1:~# zfs get atime local-zfs
NAME       PROPERTY  VALUE  SOURCE
local-zfs  atime     on     default
root@pve1:~# zfs set atime=off local-zfs
root@pve1:~# zfs get atime local-zfs
NAME       PROPERTY  VALUE  SOURCE
local-zfs  atime     off    local

When using ZFS as the storage backend for Proxmox virtual machines, it’s essential to optimize the configuration for better performance and reliability. Here are some recommendations for configuring ZFS in a Proxmox environment:
- Use appropriate ashift: Set the ashift value according to your storage device’s block size. For modern SSDs and NVMe drives, this is typically 12 (corresponding to a 4K block size). When creating a new ZFS pool, use the following command:
luaCopy code
`zpool create -o ashift=12 yourpoolname yourdevice`
- Enable compression: Use LZ4 compression to reduce the amount of data written to the storage devices, which can help improve performance and save space. To enable compression on a ZFS pool, run:
pythonCopy code
`zfs set compression=lz4 yourpoolname`
- Optimize record size: Set the record size according to your workload. For VM storage, a smaller record size like 16K or 32K is generally recommended to handle small random I/O operations efficiently. To set the record size for an existing dataset, use:
bashCopy code
`zfs set recordsize=32K yourpoolname/yourdataset`
- Disable atime: Turn off access time (atime) updates to reduce unnecessary writes and improve performance. To disable atime for an existing dataset, run:
bashCopy code
`zfs set atime=off yourpoolname/yourdataset`
Use appropriate redundancy: Configure your ZFS pool with the desired redundancy level, such as RAIDZ, RAIDZ2, or RAIDZ3, depending on your storage requirements and fault tolerance needs.
- Enable TRIM/discard support: TRIM allows the SSD to be aware of unused blocks, improving wear leveling and performance. To enable TRIM on a ZFS pool, run:
csharpCopy code
`zpool set autotrim=on yourpoolname`
Use a SLOG device (optional): For environments with high synchronous write workloads, consider using a fast separate SSD or NVMe as a SLOG (ZFS Intent Log) device to cache synchronous writes and improve performance.
- Use thin provisioning: Configure your VMs to use thin provisioning with the ‘discard’ option enabled. This helps reduce unnecessary writes and save storage space.
Remember to monitor the health and performance of your ZFS pool and adjust the configuration as needed to ensure optimal performance and reliability for your Proxmox virtual machines.
$ apt install sysstat
$ iostat 600 2 -m
Linux 5.15.102-1-pve (pve1)     03/21/2023      _x86_64_        (16 CPU)

avg-cpu:  %user   %nice %system %iowait  %steal   %idle
          15.93    0.00    2.86    3.43    0.00   77.78

Device             tps    MB_read/s    MB_wrtn/s    MB_dscd/s    MB_read    MB_wrtn    MB_dscd
dm-0              0.00         0.00         0.00         0.00          4          0          0
dm-1              5.23         0.00         0.02         0.23        668       6110      57159
dm-10             0.00         0.00         0.00         0.00          1          0          0
dm-11             0.00         0.00         0.00         0.00          1          0          0
dm-12             0.00         0.00         0.00         0.00          2          0          0
dm-13             0.00         0.00         0.00         0.00          2          0          0
dm-14             0.00         0.00         0.00         0.00          3          0          0
dm-15             0.00         0.00         0.00         0.00          3          0          0
dm-16             0.00         0.00         0.00         0.00          3          0          0
dm-17             0.00         0.00         0.00         0.00          3          0          0
dm-18             0.00         0.00         0.00         0.00          3          0          0
dm-19             0.00         0.00         0.00         0.00          3          0          0
dm-2              0.25         0.00         0.00         0.00        239          4          0
dm-20             0.00         0.00         0.00         0.00          3          0          0
dm-3              3.53         0.02         0.03         0.00       6181       6647          0
dm-4              3.53         0.02         0.03         0.00       6181       6647          0
dm-6              0.00         0.00         0.00         0.00          1          0          0
dm-7              0.00         0.00         0.00         0.00          1          0          0
dm-8              0.89         0.00         0.00         0.00        141        805          0
dm-9              2.64         0.02         0.02         0.00       6034       5834          0
nvme0n1         701.24         0.15         5.68         5.13      37318    1438834    1299568
nvme1n1         700.95         0.15         5.68         5.13      37121    1438834    1299567
sda               7.20         0.08         0.05         0.23      19784      12762      57669
sdb              99.15         0.09         6.37         0.00      22788    1614450          0
sdc             102.41         0.09         6.37         0.00      22759    1614450          0
zd0              40.83         0.01         0.23         0.03       3298      58112       7072

avg-cpu:  %user   %nice %system %iowait  %steal   %idle
          15.30    0.00    2.49    0.29    0.00   81.92

Device             tps    MB_read/s    MB_wrtn/s    MB_dscd/s    MB_read    MB_wrtn    MB_dscd
dm-0              0.00         0.00         0.00         0.00          0          0          0
dm-1              5.40         0.00         0.02         0.00          0         13          0
dm-10             0.00         0.00         0.00         0.00          0          0          0
dm-11             0.00         0.00         0.00         0.00          0          0          0
dm-12             0.00         0.00         0.00         0.00          0          0          0
dm-13             0.00         0.00         0.00         0.00          0          0          0
dm-14             0.00         0.00         0.00         0.00          0          0          0
dm-15             0.00         0.00         0.00         0.00          0          0          0
dm-16             0.00         0.00         0.00         0.00          0          0          0
dm-17             0.00         0.00         0.00         0.00          0          0          0
dm-18             0.00         0.00         0.00         0.00          0          0          0
dm-19             0.00         0.00         0.00         0.00          0          0          0
dm-2              0.14         0.00         0.00         0.00          0          0          0
dm-20             0.00         0.00         0.00         0.00          0          0          0
dm-3              3.64         0.00         0.02         0.00          0         10          0
dm-4              3.64         0.00         0.02         0.00          0         10          0
dm-6              0.00         0.00         0.00         0.00          0          0          0
dm-7              0.00         0.00         0.00         0.00          0          0          0
dm-8              0.99         0.00         0.00         0.00          0          2          0
dm-9              2.65         0.00         0.01         0.00          0          8          0
nvme0n1         843.49         0.04         5.74        10.32         23       3441       6193
nvme1n1         843.01         0.04         5.74        10.32         22       3441       6193
sda               7.77         0.05         0.04         0.00         30         24          0
sdb              31.82         0.00         0.61         0.00          0        363          0
sdc              32.02         0.00         0.61         0.00          0        363          0
zd0              42.59         0.00         0.23         0.00          0        140          0
zd112             0.00         0.00         0.00         0.00          0          0          0
zd128             0.00         0.00         0.00         0.00          0          0          0
zd144             0.00         0.00         0.00         0.00          0          0          0
zd16             42.32         0.00         0.23         0.00          0        140          0
zd160             0.00         0.00         0.00         0.00          0          0          0
zd176             0.00         0.00         0.00         0.00          0          0          0
zd192             0.00         0.00         0.00         0.00          0          0          0
zd208             0.00         0.00         0.00         0.00          0          0          0
zd224             0.00         0.00         0.00         0.00          0          0          0
zd240             0.00         0.00         0.00         0.00          0          0          0
zd256             0.00         0.00         0.00         0.00          0          0          0
zd272             0.00         0.00         0.00         0.00          0          0          0
zd288             0.00         0.00         0.00         0.00          0          0          0
zd32             16.37         0.09         0.14         0.00         52         84          0
zd48              9.00         0.00         0.07         0.00          0         40          0
zd64             10.29         0.00         0.07         0.00          0         43          0
zd80              8.21         0.00         0.08         0.00          0         45          0
zd96             43.35         0.00         0.24         0.00          0        144          0
The iostat command is a Linux system monitoring tool that reports input/output (I/O) statistics for devices and partitions. It helps you monitor the performance of your storage devices and detect potential bottlenecks or issues.
The command iostat 3600 2 specifies two arguments:
3600: This is the interval between reports, measured in seconds. In this case,iostatwill wait for 3600 seconds (1 hour) between each report.2: This is the count or the number of reports that will be generated. In this case,iostatwill generate 2 reports.
When you run iostat 3600 2, it will generate an initial report based on the statistics since the system was last booted. After 1 hour (3600 seconds), it will generate a second report based on the statistics collected during that interval. After the second report is displayed, the command will exit.
Using iostat with an interval and count can help you monitor storage performance over a specific period and detect trends or issues that may occur during that time. This can be particularly useful for troubleshooting or optimizing storage configurations.
Reference: